
Data input
How to get your flow data into the builder.
#Flow table
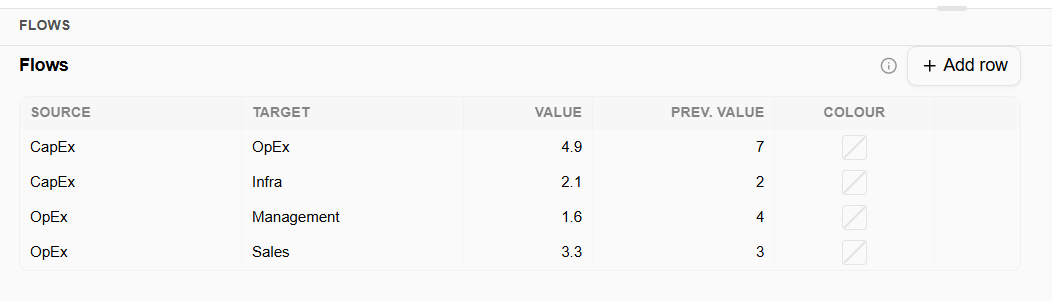
Each row in the flow table describes one flow: source, target, value, and an optional previous value (used for period-over-period change labels). The node list and chart layout are generated automatically from these rows — you never define nodes separately.
#Pasting from a spreadsheet
Click into the flow table and paste cells copied from Excel, Google Sheets, or any tab-separated data. SankeyKit reads source, target, value, and (if present) a fourth previous-value column.
#Adding rows manually
Use the + Add row button to add flows one at a time, typing the source, target and value directly into the table.
#Node styling
Once your flows are entered, the node list on the right lets you rename, recolor, and add a subtitle to each node — see Styling your chart.